Review of NL Export Data Compared to the other Atlantic Provinces
The export data allows us to compare how NL export prices stack up against prices from other provinces. The chart below shows the average export price to the US from each of the Atlantic provinces (NB, NS, PE, and NL) for April to September for the last ten years.
TABLE 1: Shows that the export price of NL crab is well within the range of prices from the other provinces. But what we do notice is that starting in the spring of 2023, the NL export price trended below the other provinces, whereas prior to that point, NL crab generally received a higher price per pound than the other Atlantic provinces.
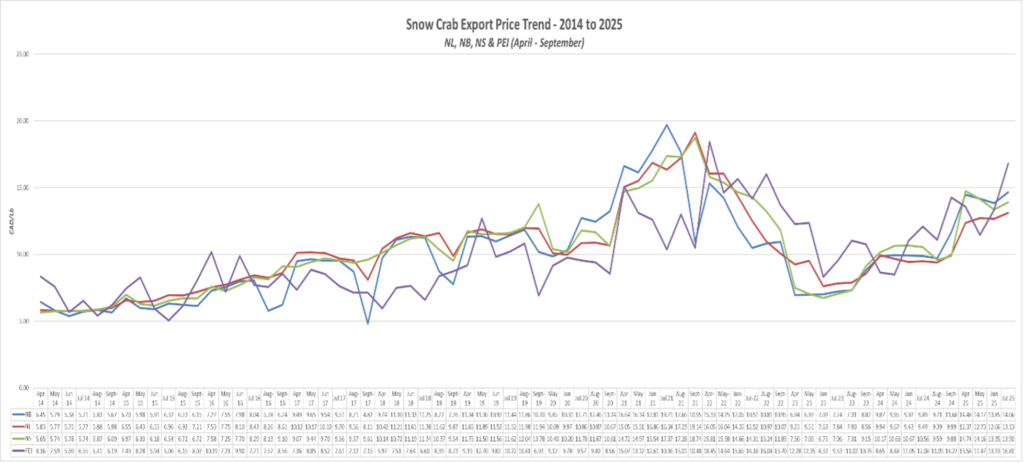
TABLE 2: The chart combines export prices to the US from NB, NS, and PE (called Gulf; orange line) and compares it against NL (blue line). From 2014 to 2020, the prices from both regions trended very closely together, with NL export prices often slightly above those of the Gulf. Since 2020, prices from the two regions do not trend as closely, and NL export prices have been slightly below Gulf prices.
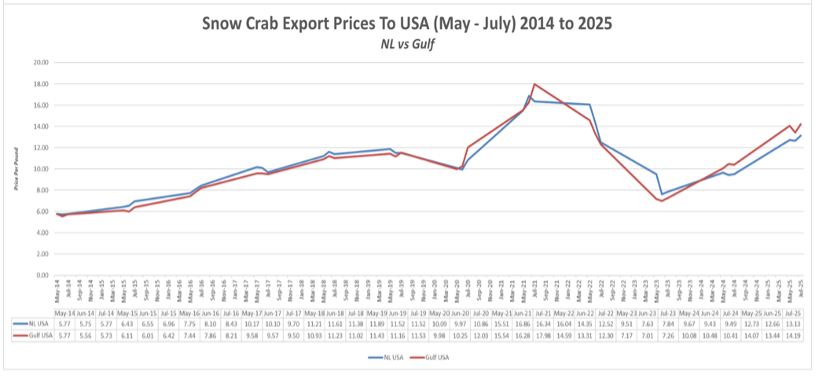
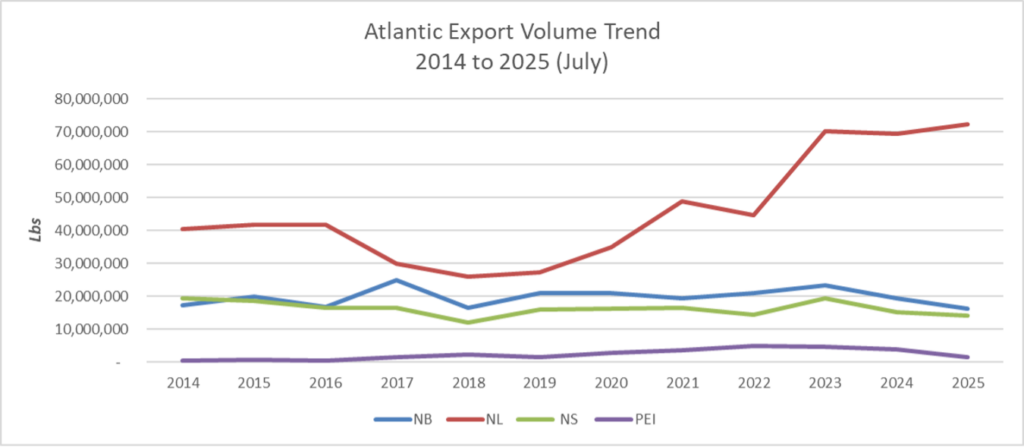
TABLE 3: NL is by far the most dominant supplier of snow crab in the Atlantic provinces. The table shows that from 2020 to 2025, NL has exported more crab than the other provinces combined.